Import Rating Data From Local Files
In this section, you start working with FusionCreator App Builder by doing a simple task: import some data from a local file and display them in a table.
Prepare the Workspace
To prepare the workspace
- In FusionCreator App Builder create a new workspace and name it Exposure per Customer Rating. The workspace is created and with a default board.
- Rename the Default board to Overview.
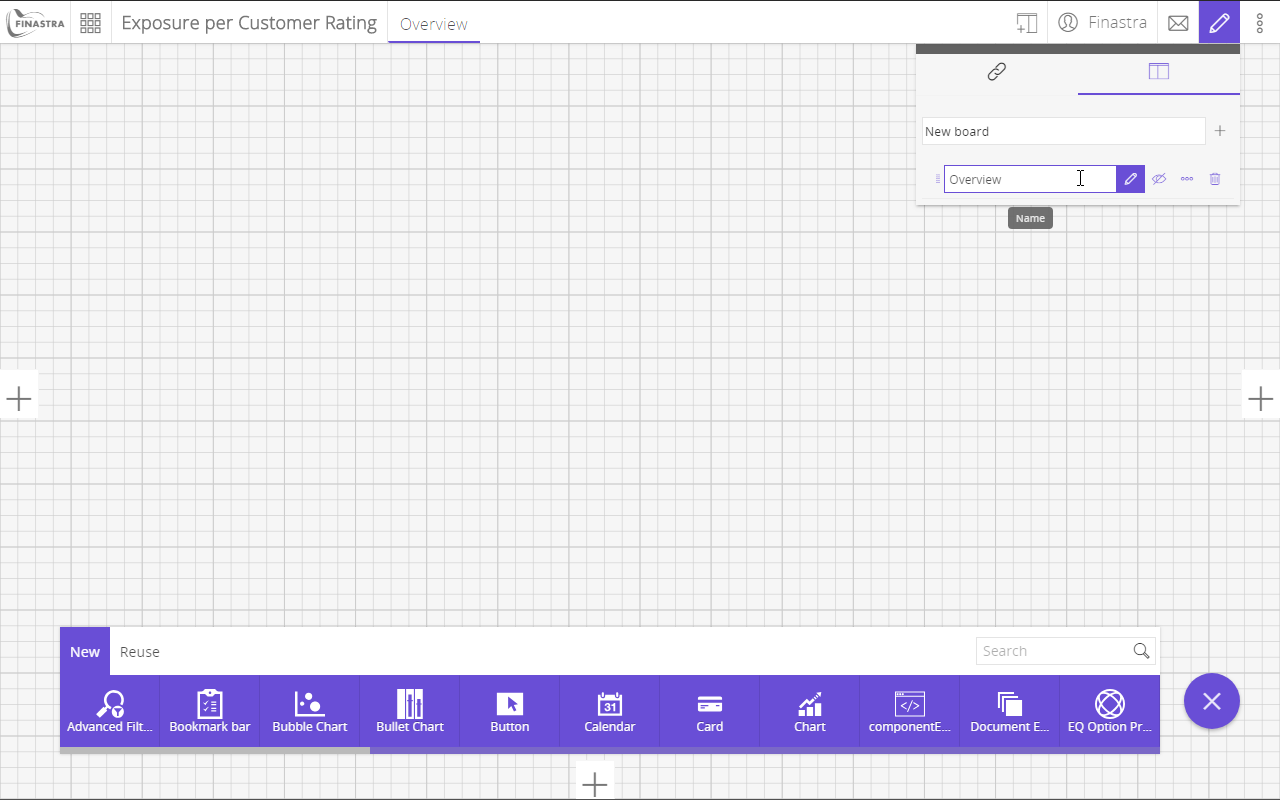
Fig. 13: Create the Exposure per Customer Rating workspace with the Overview board.
For the rest of this tutorial you will work on this board.
Sample Data
For the purpose of this tutorial, you will use the data from the following code sample, that contains the rating per company.
ID:PK;Customer;Rating
string;string;string
1;Protea Hospitality Group (Pty) Limited;2 - Good Risk
2;National Airways Corporation (Pty) Limited;3 - Fair Risk
3;ASL Aviation Group Limited;4 - High Risk
4;Millmerran Finance Company Pty Ltd;2 - Good Risk
5;DCT GDANSK SA;1 - Low Risk
6;Sofia III Sarl;4 - High Risk
7;MILLERS POINT PARKING PTY LTD;1 - Low Risk
8;Integer Home Loan (Pty) Limited;4 - High Risk
9;Discovery Health (Pty) Limited;3 - Fair Risk
10;SDD Limited;3 - Fair Risk
11;Riverside Resource Recovery Limited;4 - High Risk
12;Redefine Australian Investments Ltd;1 - Low Risk
13;Investec Mortgage Funding;1 - Low Risk
To prepare the sample data
- Copy and paste the above code into a blank text file.
- Save the file with the name
Rating.csv.
The sample file contains a table with 3 columns of type string: Id, which is the primary key, Customer and Rating.
To find out more about the formatting rules that apply to CSV files that you import, see FusionCreator App Builder Documentation
Import CSV Data
To import data from a local CSV file
- On the home page, click in the top-right corner to open the Tools hub.
- Click . The Data source editor of FusionCreator App Builder opens.
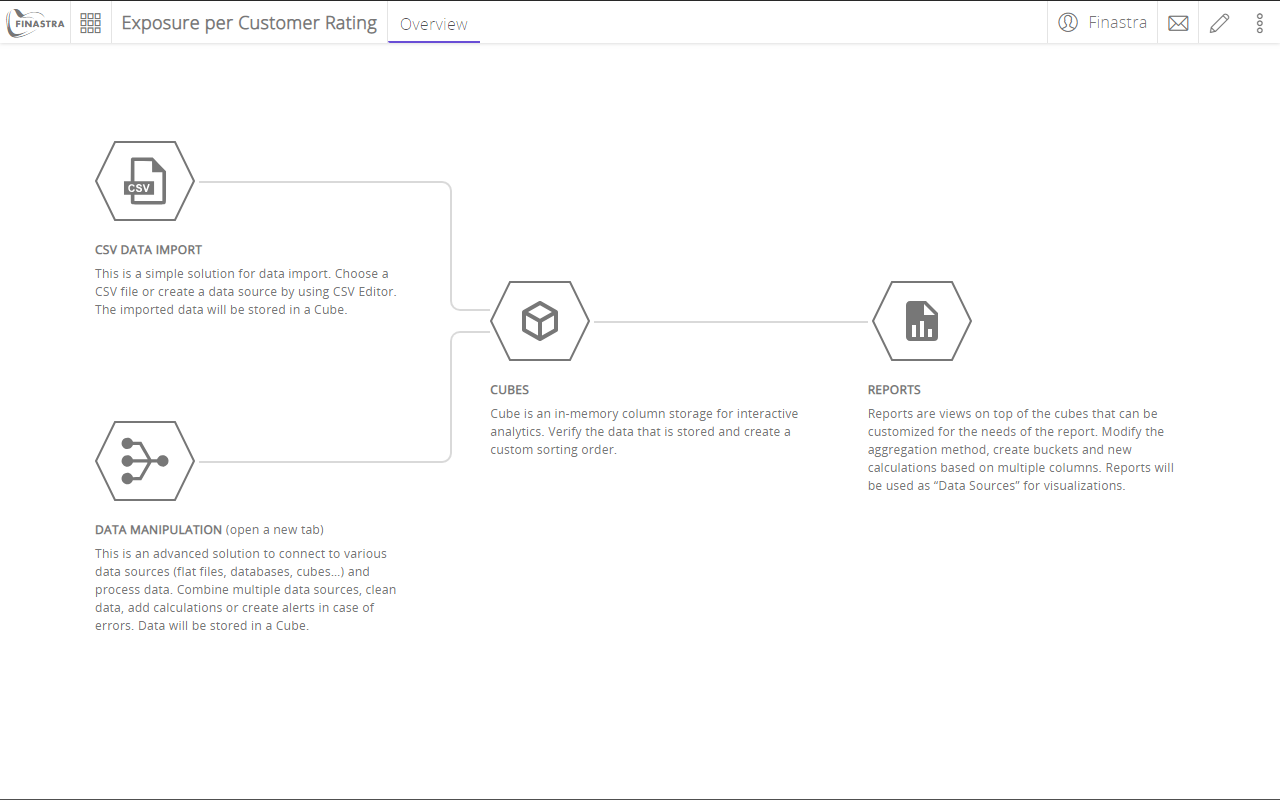
Fig. 14: The Data source editor landing page.
- Click CSV DATA IMPORT.
- Drag the Rating.csv file from your computer to the drag&drop a file area on the CSV DATA IMPORT page.
- Check the name of the cube in Cube Name field. You can leave it Rating.
- Click Import to import the data from the Rating.csv file in the Rating cube. The process is confirmed by a message.
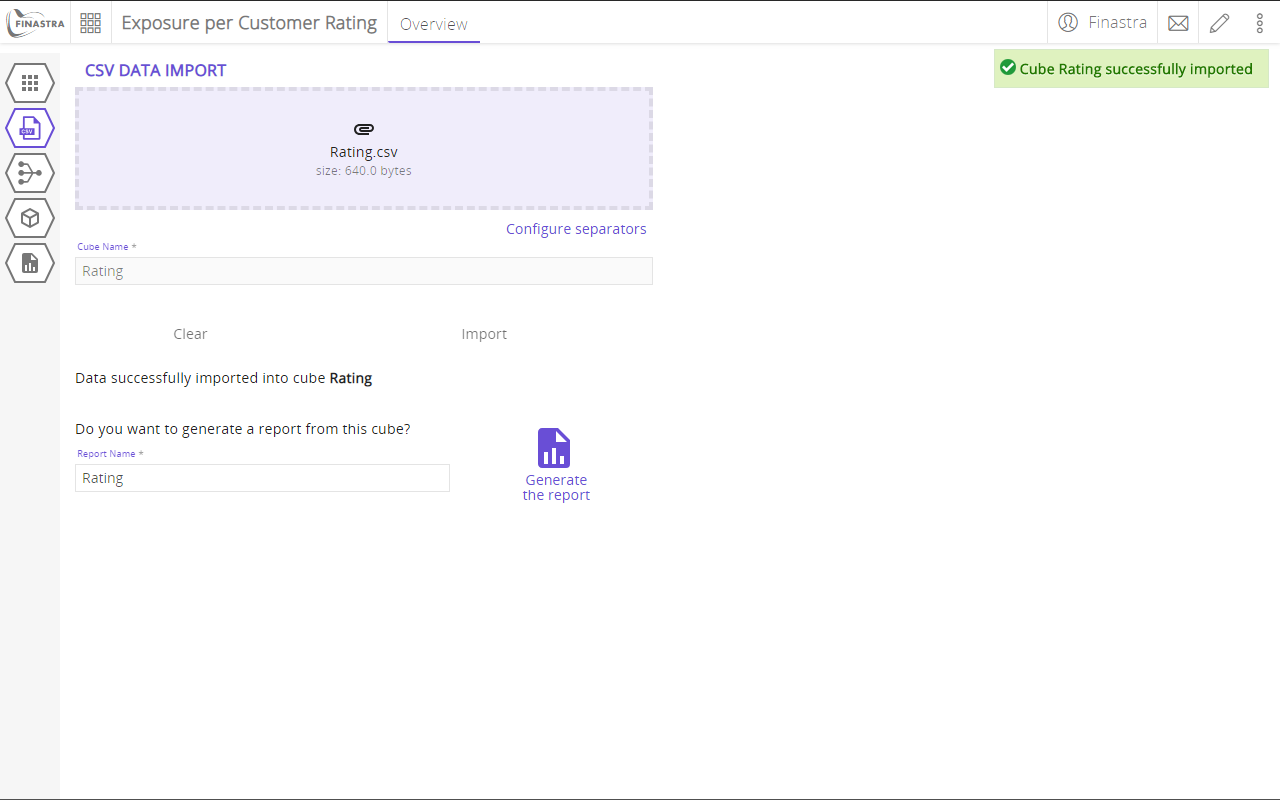
Fig. 15: The CSV DATA IMPORT page displaying the confirmation message of a successfully imported CSV file.
- Leave the default name of the report in Report Name: Rating.
- Click Generate the report to generate a report on top of the newly created cube. This report is the source of data for your further data visualizations.
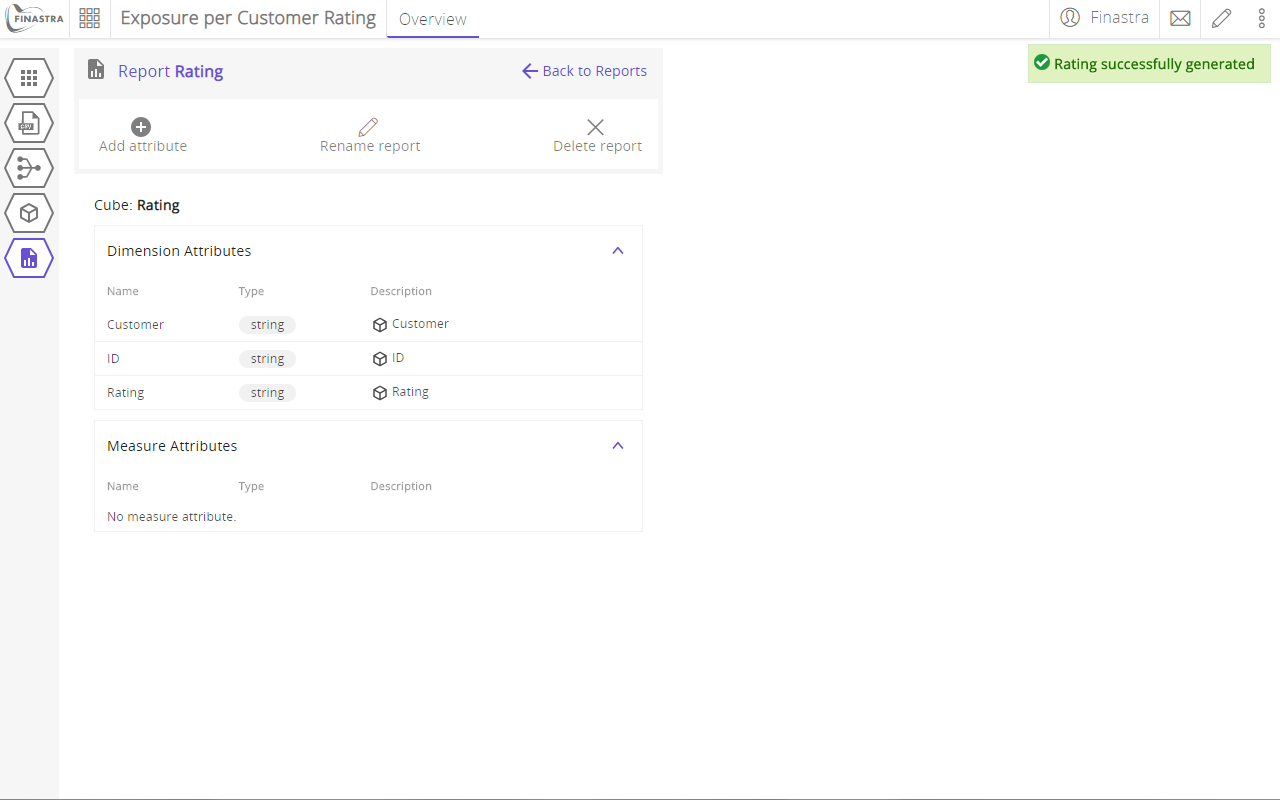
Fig. 16: The CSV DATA IMPORT page displaying the confirmation message of a successful CSV import process.
Display a Summary Table
To display your data in a summary table
- Click in the top-right corner. The UI switches to Design mode.
- Select an area in the upper left side of the board to create a frame for the table.
- From the Components bar, find and select the Table component. The table is added to the frame that you previously created.
- Configure the table component as follows:
- Title:
Customer Rating. Also click to show the table title. - Data source - search and select the Rating report.
- Columns - select the Customer and Rating columns.
- Title:
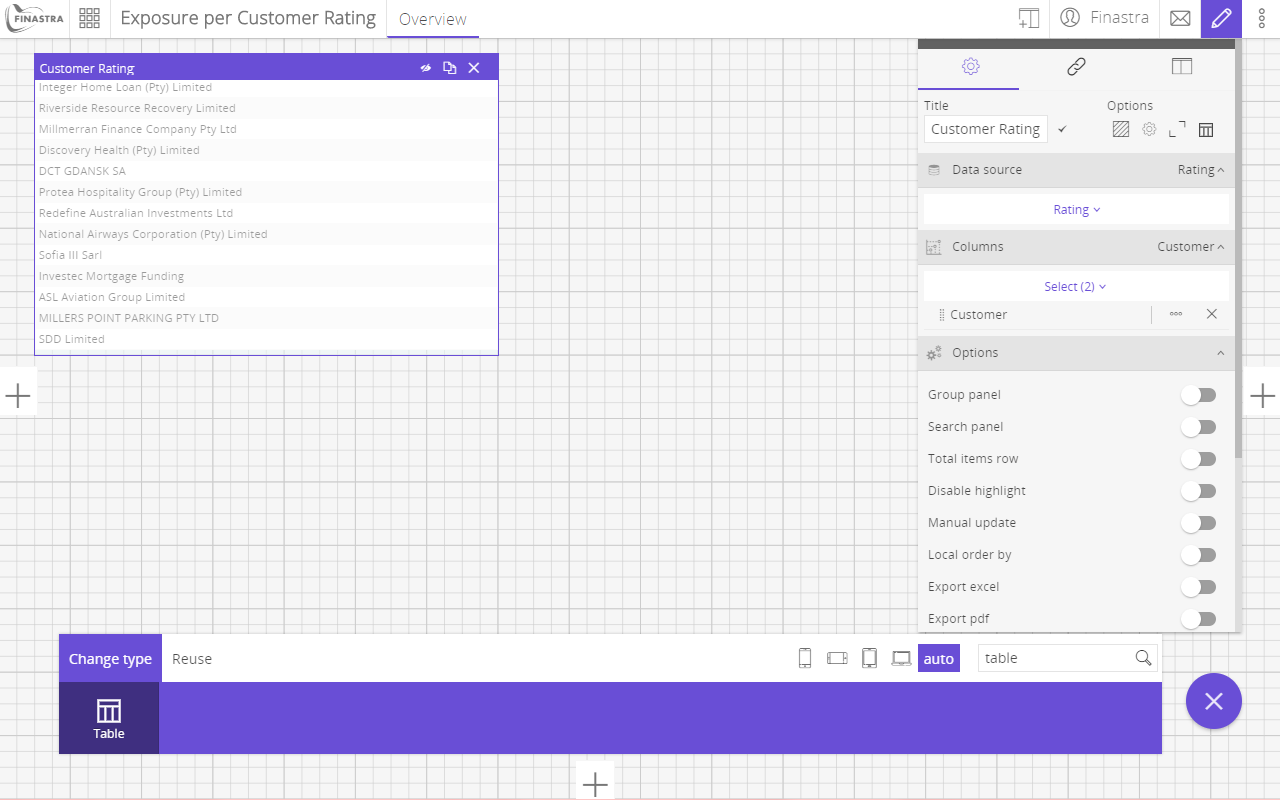
Fig. 17: Add a Table component.
- Turn off the Design mode to visualize the table in the Overview board.
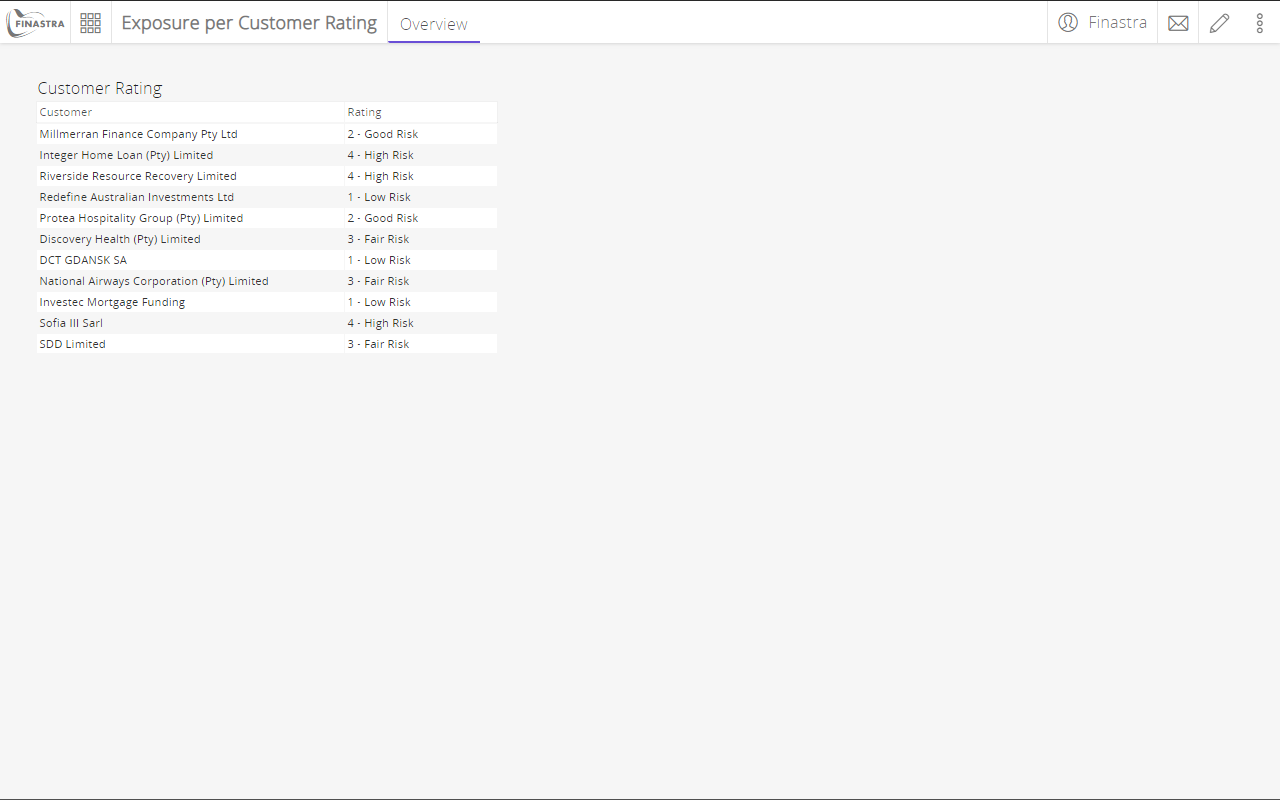
Fig. 18: The table component.